| PAGE 3 OF 3 | [1] [2] [3] | DOWNLOAD PDF |
Richard L Gregory, Priscilla Heard
From: Perception, 1979, volume 8, pages 365-380
Brain and Perception Laboratory, University of Bristol, Department of Anatomy. The Medical School. University Walk, Bristol BS8 1TD. England
continued
3 Results
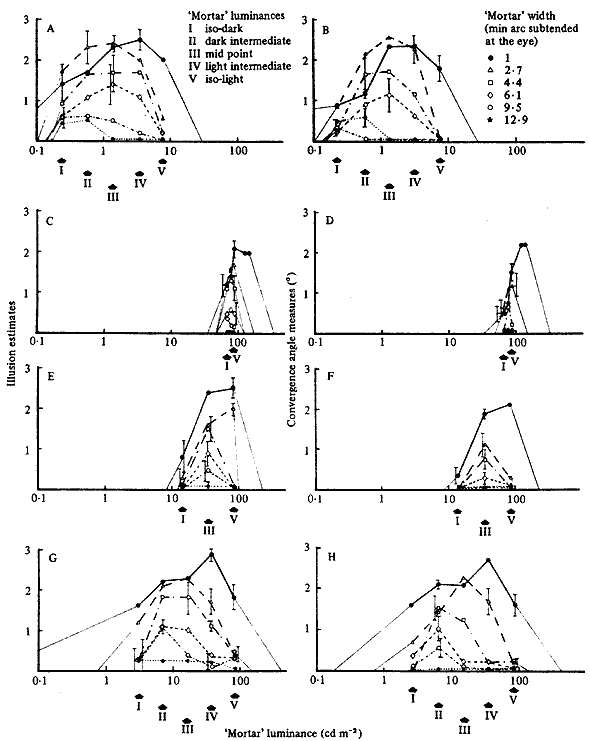
The results are shown in figures 9 and 10. Separate graphs have been drawn for subjects' rating of the illusion, and for their setting of the adjustable wires to match the wedge distortion. These two measures are in close agreement. Figure 9 shows how the magnitude of the illusion varies as a function of mortar width and of luminance for four of the conditions. When the tiles were isoluminant there was no illusion, as Yvonne Lammerich found (Gregory 1977). (Contrasting coloured tiles can be produced with, say, red and green filters in the on-axis and off-axis projectors respectively.) Figure 9 shows the mean scores for the five subjects. The maximum and minimum standard deviations are shown for each border width. The other standard deviation values have been omitted from these graphs for the sake of clarity. It can be seen that:
(i) As the mortar width is increased beyond 1 mm of arc the maximal distortion decreases, Very little distortion is seen (at least for most people with good visual accommodation) with mortar widths greater than 10 mm of arc subtended at the eye. (ii) As the mortar width is increased beyond 1 mm of arc, the upper and lower limits of the mortar luminance at which the illusion is elicited decrease. At about 8 mm of arc the mortar luminance must lie rather precisely midway between the dark-tile and light-tile luminances for the illusion to appear.
(iii) For the illusion to occur, the mortar luminance must not be significantly lower than the dark-tile luminance or higher than the light-tile luminance. With increasing contrast between the dark and light tiles, tile range of acceptable mortar luminance increases. At isoluminance of the tiles there is no mortar luminance which gives the illusion. The illusion is generally judged as less compelling for any mortar luminosity at low (0.11) tile contrasts. There is evidence that the maximum width of the mortar giving the illusion falls with reduced tile contrast- As can be seen from figure 9, there is practically no change in the maximum mortar width giving the illusion over the contrast range 0.94 - 0.69, but the maximum is reduced for the range 0.69 - 0.11.
(iv) When the luminance of the light tiles is reduced from 86 cd m-2 to 7.6 cd m-2 there is little change in the observed distortion; but the measures (figure 9) show a small increase with the lower luminance.

Figure 9. The Café Wall illusion (Estimates on the left, Measures by matching on the right) for six mortar-line widths. The light-tile luminance of A and B is 7.6 cd m-2 and of C to H is 86 cd m-2. The tile contrasts are: for A, B, G, and H, 0.94; for C and D, 0.11; for E and F, 0.69. The arrows on the absissae indicate critical mortar luminaces (from left to right): isoluminance with the dark tiles; various intermediate values; isoluminance with the light tiles. Each point is the mean of five subjects. Error bars show the maximum and minimum standard deviations.
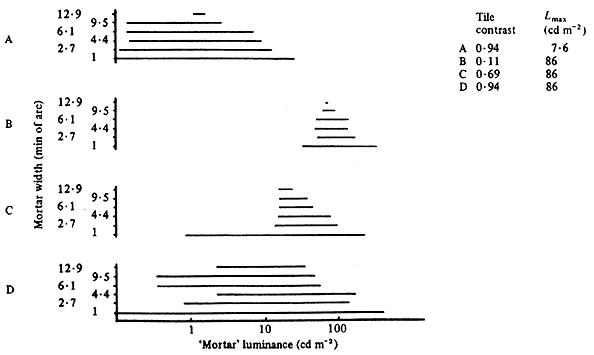
The illusion decreases with increase in mortar line width (from 1 mm to 12.9 mm of arc subtended at the eye). The range of mortar luminances giving significant illusion decreases with decreased tile contrast, and decreases with increased mortar width. For mortar widths greater than 4.4 mm of arc, the illusion is greatest at mortar luminances intermediate between the dark-tile and light-tile luminances. Very little illusion occurs with mortar widths greater than 2.7 mm of arc when the mortar is darker than the dark, or lighter than the light tiles. For widths less than 2.7 mm of arc, illusion can occur somewhat beyond isoluminance with the tiles: especially at low tile luminances with high contrast; and, less markedly, for high tile luminance with low contrast.

Figure 10. The horizontal bars show the range of mortar luminance over which illusion occurs (from verbal reports of five subjects). Graphs A and D show the effect of the high tile contrast of 0.94. Graph B shows the effect of the low tile contrast of 0.11. Graph C shows the effect of the intermediate contrast of 0.69. The light-tile luminance of A is 7.6 cd m-2 and B to D, 86 cd m-2.
It is clear that the range of mortar luminance over which the illusion occurs decreases as tile contrast decreases; and decreases with increase in the width of the mortar lines.
4 Discussion
4.1 Is the illusion inappropriate border-locking?
This illusion is not as easy as many others to measure. When the illusion was at its strongest, matching with the variable convergence lines presented no special problems, except that the region of maximum apparent wedge angle may be less than the total length of the rows of the tiles. For the conditions giving a weaker illusion there was considerable perceptual ambiguity, the tiles sometimes appearing as separate wedges, and sometimes the rows of tiles would appear to tilt around a vertical axis in depth. The illusion was, at least when weak, affected by eye movements and it tended to fade with prolonged viewing. It is markedly affected by accommodation errors, being greater when blurred.
The smallest mortar width we have used is 1 mm of arc. Narrower widths should be examined. We find that the narrowest mortar lines we have used give the most pronounced illusory distortions. This may he surprising if we think of the distortion as simply a sucking by the locking system of the contours across the mortar; hut there is another consideration. It seems that the locking signals are drawn from fairly large regions (have low spatial frequency characteristics), so for narrow mortar lines, or other lines or borders, the effective region from which the locking signals are drawn may extend from behind the border. (We may describe this as the 'hinterland effect'.) This could explain the distortion persisting for narrow mortars somewhat darker or lighter than the tiles. It can also explain why there is any distortion in the limiting case of the Münsterberg illusion where the mortar line is lost, as it is isoluminant with the black tiles. Here the different widths of the black regions bordering the white tiles - the thin black lines and the much wider black tiles - serve to give this illusion: as they must do because they are the only asymmetry in the figure (see the caption to figure 12).
The curves shown in figure 9 have systematic asymmetries The high-contrast conditions (A. B. G, and H) show that the illusion occurs at greater widths of the mortar when its luminance is equal to that of the dark or the light tiles. Possibly this is due to the 'hinterland' behind the border contributing to the locking being greater at low luminances, which is to be expected as receptive field size increase with decreased luminance. For the low-contrast displays (C, D, E, and F) narrow mortar lines give large illusions when the mortar luminance is greater than iso-luminance with the light tiles. It is not obvious how the border-locking model should account for this.
The finding that illusion decreases at the low contrast of 0- 11 as compared to the higher contrasts of 0-69 and 094 is in close agreement with the finding, in their experiment 6, of Moulden and Renshaw (1979). However, we find a small increase in illusion when the luminance is decreased from 86 to 7'6 cd m-2. whereas Moulden and Renshaw in their experiment 5 found a decrease in illusion for a similar decrease in luminance. This difference may be due to the different contrasts of the displays: ours was 0.94 and theirs was presumably unity (as they used various back projection luminances with opaque. and so black, squares).
A reason for measuring the wedge distortion under various conditions is that it is an amplification of border shifts which are small and difficult to measure directly. especially under a variety of conditions. It is, however, not clear that the large-scale wedge distortion is a linear amplification of the tile-sized border shifts, or what the amplification factor is; though the amplification characteristics could be established from a knowledge of individual border shifts, which have indeed been measured under some conditions by Moulden and Renshaw (1979).
4.2 How is the Café Wall related to the Münsterberg illusion?
The Münsterberg figure is a special case of the Café Wall illusion, where the mortar lines are isoluminant with the dark tiles which are drawn as black rectangles (figure 2). So there are no gaps, or neutral lines, for the locking to draw borders across. Why, then, should the wedge distortion of the Münsterberg illusion occur?
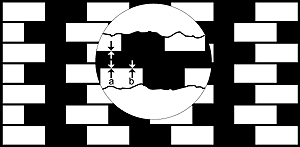
Consider figure 11. There is repeated small-scale asymmetry (as in the Café Wall though with non-isoluminant mortar lines), for the white rectangles (analogous to the light tiles of the Café Wall figure) are bounded for half their length by narrow black lines, and for the other half by wide black lines - the black rectangles. The border-locking model implies that the white - black regions are locked at their common boundary: but the different widths of the black lines and the black rectangles may give different locking signals. We might expect the wide rectangles to give stronger locking signals than the narrow lines (cf the 'Hinterland' suggestion, section 4. 1) but what is not clear is why this difference in the strength of locking signals produces the distortion in the observed direction. To explain this, we need an additional concept: perhaps that white is pulled into the black. This asymmetry would be visual: quite different of course from asymmetries of the figures. The visual asymmetry is Helmholtz's 'irradiation'. It is very interesting that the Café Wall with neutral mortar does not follow 'irradiation': for the black-tile borders are shifted into the lighter mortar. 'Irradiation' lacks a satisfactory functional or mechanism explanation. We have suggested that border locking gives a functional modus operandi for these border shifts: but a complete explanation requires details of the physiological mechanisms and their functional range which may not be optimal.

Figure 11. Explanation of the Münsterberg
illusion.
This is a limiting case of the Café Wall illusion, where
the mortar lines are isoluminant with the dark (black) tiles,
The distortion cannot now be due to locking across neutral gaps
of mortar for there are no such gaps here. We suggest that border
locking is affected by luminances in regions immediately behind
borders ('hinterland' catchment area, presumably given by receptive
fields). When the wide black rectangles fill the catchment area,
but the black lines are too narrow to fill it, the locking should
be greater at b where the white tiles border wide black tiles.
If we assume that white is pulled into black, by border locking
(as in Helmholtz's 'irradiation' effects), then perhaps we understand
why the white tiles seem to be pulled more into the black at b
that at a - to give the observed direction of distortion.
4.3 Is border locking retinal or cortical?
The Café Wall, as for the Münsterberg illusion, is wedges alternating in the direction of convergence for each row of tiles, If we suppose (and indeed this can be seen by changing the mortar luminance) that the half of each tile which faces a contrasting luminance region across the mortar is shifted towards meeting - though, at least for wide mortar lines, not quite to touch - the opposing border of contrasting luminance, then it is clear that each tile should be distorted to something like a wedge. The tiles should all have wedge distortions in the same direction for each row, and the direction of the wedge convergences should reverse for each alternate row. This should be clear from figure 1 2. Under some conditions, especially when the display is blurred, each tile is seen as a separate wedge, rather than as sections of row-long wedges. It was supposed by Fraser (1908) that such large-scale asymmetries are produced by spatial integration of each small-scale distortion (or, for the Fraser figures, misleading line elements), but it is also possible that constancy scaling is set inappropriately by the tile-sized wedges. which would be a more central process.
If the border locking normally serves, as we suppose, to maintain registration for regions of different luminance and also for different colours, from the border luminance signals, then luminance locking could be early in the visual channel: but the cortical colour-locking must be cortical - at or after the cortical maps described by Zeki (1976).

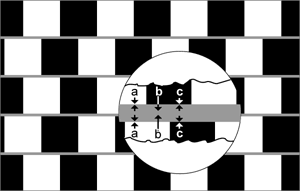
Figure 12. Explanation of the Café
Wall illusion
The 'blow up' indicates how border locking may work to give the
Café Wall illusion when the mortar lines lie within, or
are not significantly outside, the dark - light tile luminance
range. It is suggested that spatial registration is normally maintained
by signals from luminance transitions. locking contrasting luminance
and also colour regions together at common signalled borders.
This is supposed to prevent registration errors in most conditions,
but to create distortions when locking operates across neutral
gaps or lines. Thus, for the Café Wall illusion, the dark/light
tile borders would be pulled together across the neutral mortar
line where the luminance differences are large on opposite sides
of the mortar. The dark and light tile borders should each lock
onto their own side of the neutral mortar line except when there
is a strongly contrasting luminance on the other side, to capture
the boundary and pull it across the mortar. When the mortar luminance
is significantly greater or less than the luminance of the light
and dark tiles respectively, locking will no longer occur across
the mortar lines, for there will now be contiguous contrast borders
along the whole length of each tile on their own side of the mortar.
When the tiles are displaced by half a tile width in alternate rows, the locking across the mortar only occurs where half a light tile faces half a dark tile (b in the figure). Where the light halves face, and where the dark halves face, the locking will not be across the mortar, but only on their own tile - mortar borders (a and c in the figure). There are therefore different locking signals along the length of each bright and dark tile, producing wedge-like distortion of the tiles.
The row-long wedges observed may be due to spatial integration (Fraser 1908; Moulden and Renshaw 1979); or they may be due to setting up (inappropriate) depth-size scaling as has been suggested for example for the Zollner illusion (Gregory 1974).
It is, however, clear that the wedge distortion is considerably affected not only by luminances and mortar width but also by the sharpness of the retinal image and its location on the retina: the illusion increases with blur, and with peripheral rather than foveal vision. It does not, however, follow that the illusion must be retinal in origin, for these differences may change the kind of signals received for cortical locking. One might think the issue could be decided by stereoscopic experiments applying Julesz's (1971) paradigm, in which one eye is presented with insufficient information and the other with the needed remainder. Since neither eye's image is adequate, there must be central binocular synthesis. If this illusion occurs with binocular synthesis of the tiles in one eye and the mortar in the other, there must be a cortical component, at or after binocular synthesis. We have, however, reservations over applying this paradigm here, for not only are the stereo pairs of the Cafe-Wall-like display difficult to fuse because of rivalry, but, much more fundamental, it may be that the stereo signals from retinal disparity are taken off before the border locking. This would be a good design feature, for, though border locking would help object recognition by avoiding spurious gaps and lines due to misregistration, the distortions which must occur in order to achieve locking would, when horizontally opposed in the two eyes, produce disparity errors which would upset stereo-signalled depth. Since but small disparities serve to signal stereo depth, small horizontal distortions should have devastating effects on stereo vision. A later paper will report evidence that the retinal signals accepted for stereo are not the same signals as those giving the shifted borders of these illusions. If the stereo signals are not affected by border locking, then we cannot apply the Julesz paradigm for deciding whether these shifts have a retinal or a central origin.
Acknowledgements
We thank the Medical Research Council for their support of the Brain and Perception Laboratory, Dr Mark Georgeson for helpful comments, and Philip Clark for photographic and technical assistance. We would like to thank our subjects for their patience.
References
Fraser J, 1908 "A new visual illusion of direction" British Journal of Psychology 2 307 - 320
Gregory R L. 1973 "The confounded eye" in Illusion in Nature and Art Eds R L Gregory, C E Gombrich (London: Duckworth) pp 49-95
Gregory R L, 1977 "Vision with isoluminant colour contrast" Perception 6 113-119
Julesz B 1971 Foundations of Cvclopean Perception (Chicago: University of Chicago Press)
Moulden B, Renshaw J, 1979 "The Münsterberg illusion and irradiation" Perception 8 275 - 301
Shubnikov A V, Koptsik V A, 1974 Symmetry in Science and Art (New York: Plenum Press)
Zeki S M, 1976 "The functional organization of projections from prestriate visual cortex in rhesus monkey" Cold Spring Harbour Symposium on Quantitative Biology 40 591 -600
Received 1 August 1979
© 2001 Richard Gregory and Priscilla Heard
